
Overview
2018 has drawn to a conclusion and Gas Strategies has taken the opportunity to have a first look at preliminary LNG supply and demand data for the year.
Traded LNG volumes increased by 9.7% year-on-year in 2018 to a total of 318 million tonnes (mt). Surging supply from Australia, the US and Russia was absorbed by continued strong demand growth in North Asia (led by China), but in quarter 4 we saw a strong uptick in LNG deliveries to NW Europe in what could be a sign of a loosening LNG market in 2019.
Figure 1: Global LNG volumes and key demand regions, 2016 - 2018
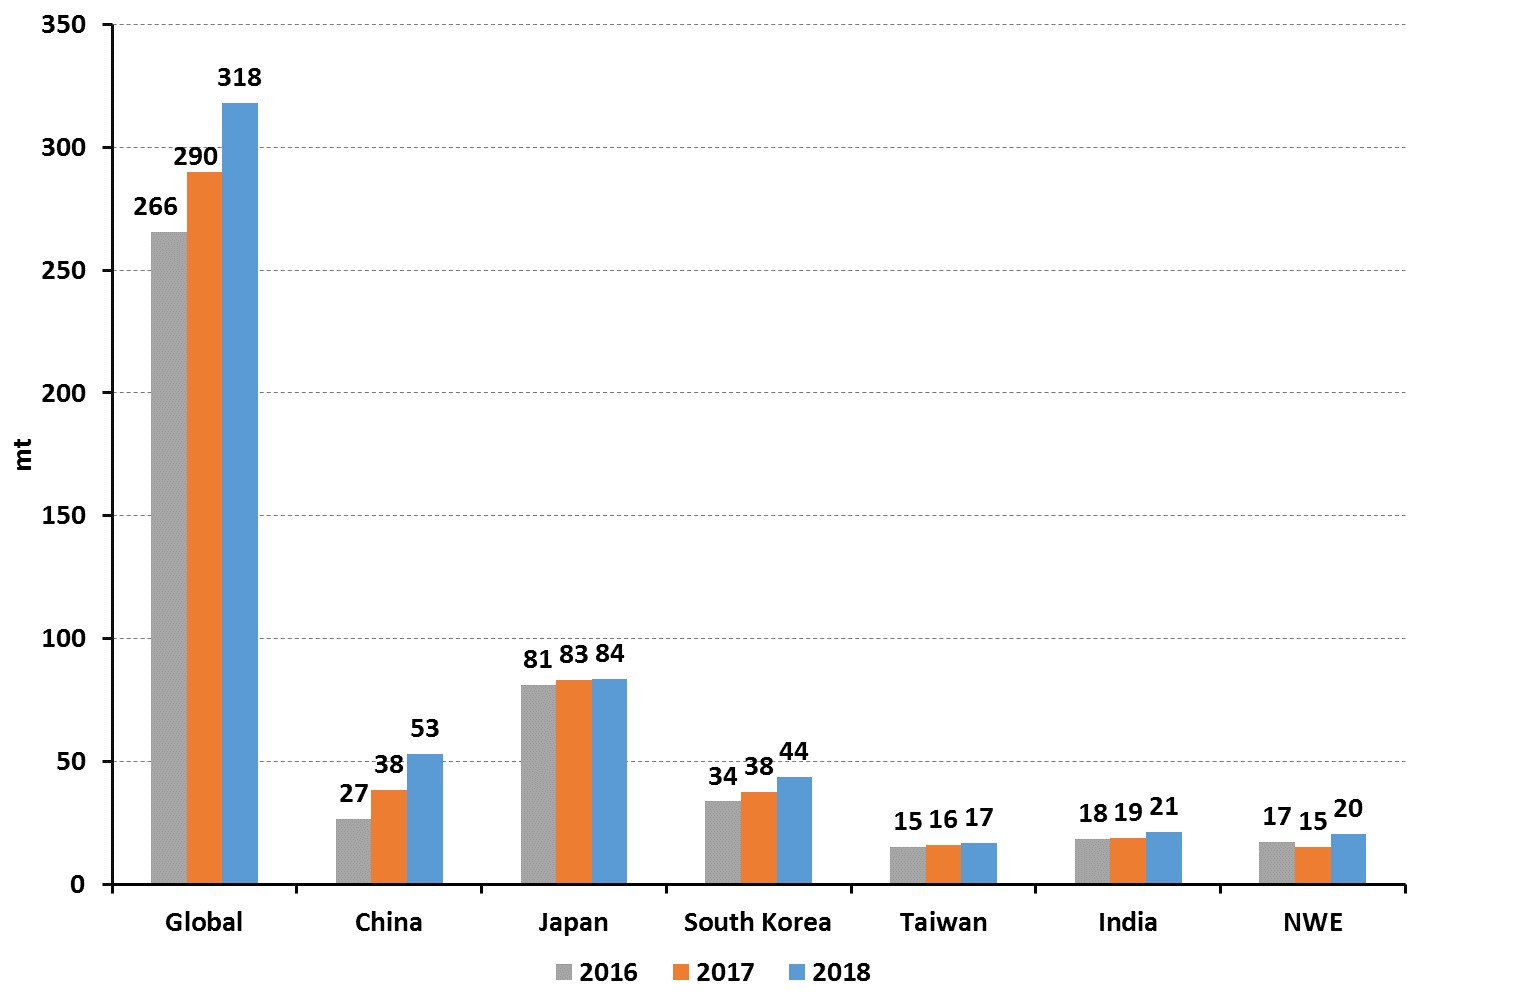
Source: Gas Strategies and Thomson Reuters
Demand Highlights
China leads the way once more
China’s LNG imports increased by almost 15 mt in 2018 to 53 mt, a product of both strong economic growth and a continued government drive to improve air quality by switching energy consumers from coal to gas. This winter alone China has connected approximately 3.3 million households to the gas grid. With total gas consumption in China last year estimated to have reached circa 270 bcm, up from 240 bcm in 2017, initial calculations suggest that LNG supplied ~70% of the incremental year-on-year gas demand growth. This trend is expected to continue into 2019 before new pipeline gas supply starts to come on stream from Russia.
South Korea surpasses expectations
The past year has also seen substantial growth for South Korea, with imported volumes growing YoY by 16.9% (or 6.3 mt) to 43.5 mt. Demand growth in 2018 was driven by the power sector as nuclear-powered generation fell to a utilisation rate of only 63.6% for Q1 – Q3 (Q4 data not yet available). The low nuclear availability comes at a time when the country, under the liberal Government of Moon Jae-in, continues to transition away from coal and towards gas-fired power generation as defined in the countries ‘7th Basic Plan’. Despite the strong LNG demand growth, a similar trend for 2019 is not expected and there may even be a slight decline as several nuclear reactors are due to come back online post maintenance. Two 1400 MWe nuclear reactors are also currently under construction and due to come online this year.
North west Europe absorbs excess volumes in Q4
NW Europe acted as sink for surplus LNG supply in Q4 2018, with imports surging by ~130% compared to the same period in 2018. The chart below shows just how steep the increase in imports was. The import growth was driven by a combination of factors leading to the arbitrage between European and Asian markets shrinking significantly, as relatively strong European hub prices combined with new LNG supply projects ramping up, lackluster Asian demand, high Asian inventory levels and soaring shipping rates. This made NW Europe the destination of choice for players with excess volumes.
Figure 2: North west Europe quarterly imports
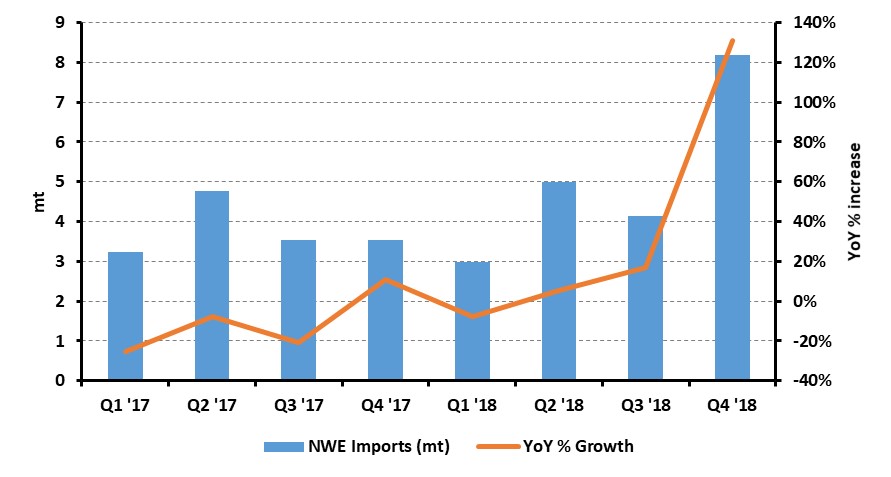
Source: Gas Strategies and Thomson Reuters
Supply Highlights
The supply story of 2018 was dominated by the continued growth of two major exporters, Australia and the United States. Australian production grew by a total of ~12.6 mt with the emergence of Wheatstone adding 6.3 mt, and the continued ramp-up of Gorgon contributing 4.4 mt.
The USA continues to cement its status as a new major LNG player. 2018 saw Sabine Pass volumes ramp-up by 5.7 mt to a total of 19 mt. On the east coast, Cove Point produced its first cargoes and is well on the way to ramping up to full capacity (5 mtpa), producing ~2.6mt in 2018. Cheniere’s Corpus Christi also dispatched the first of its commissioning cargoes in December and will be a source of supply growth in 2019.
Novatek’s Yamal LNG in Russia has also been ramping up production rapidly since loading its first commissioning cargo in December ’17. The project has brought on two more trains in the space of 12 months and in 2018 produced 7.5 mt of LNG. The third train was brought on-line a full one year of schedule in what must be viewed as one of the most impressive project executions in the history of the industry.
Figure 3: 2018 vs 2017 supply change
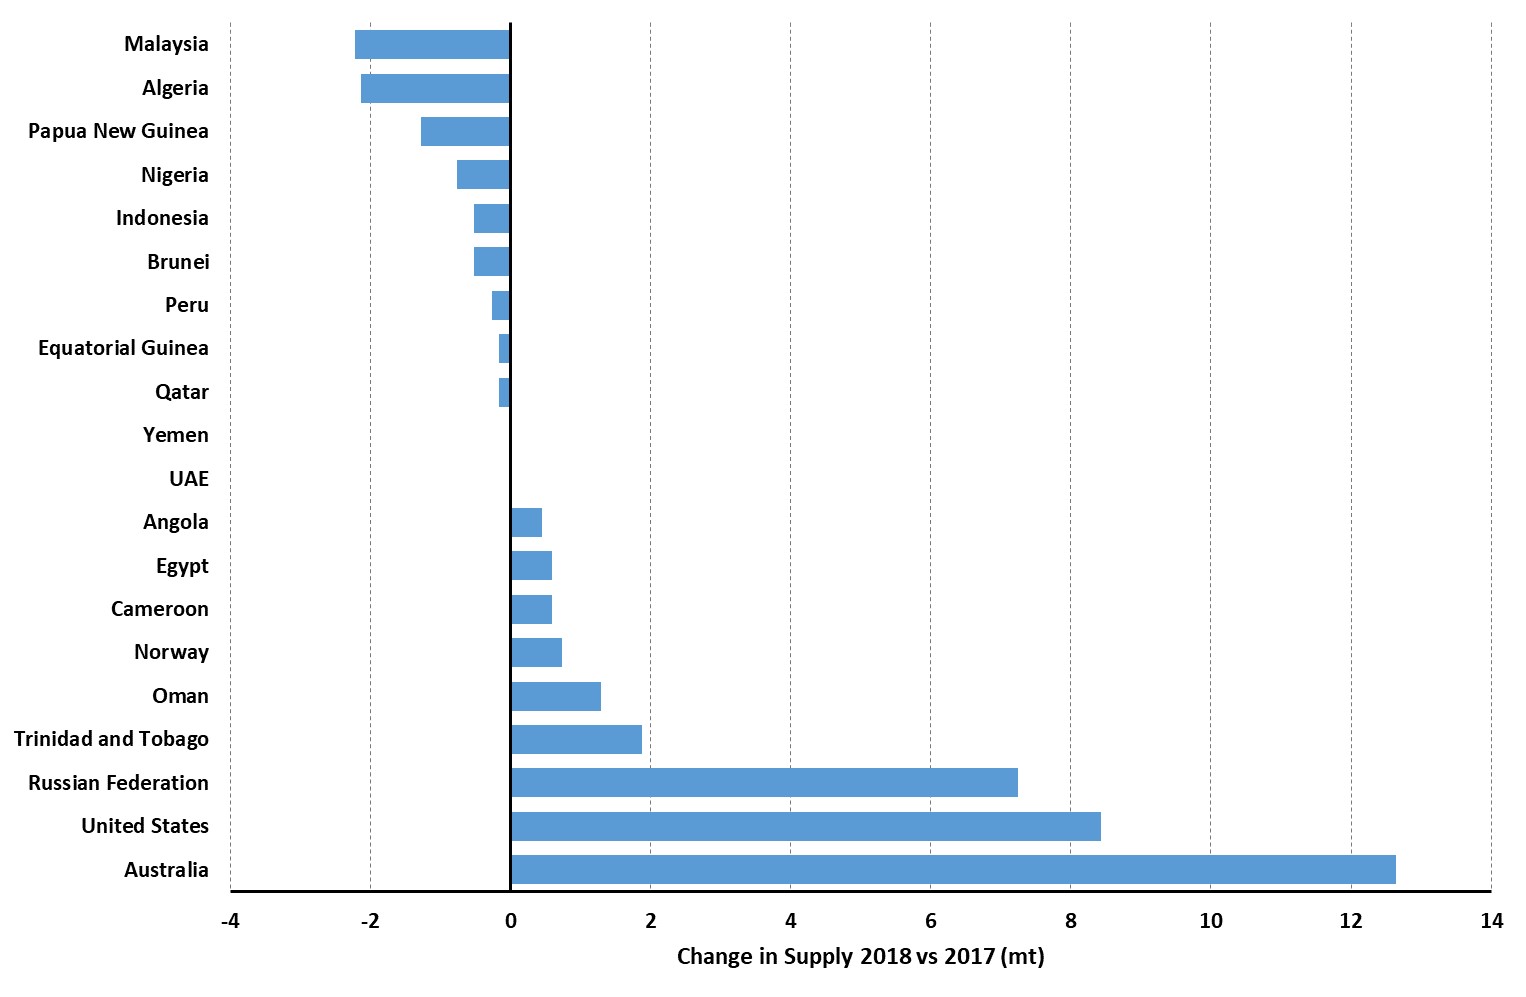
Source: Gas Strategies and Thomson Reuters
2019 outlook
The coming year looks set to be another exciting one for the LNG industry. Almost 35 mtpa of liquefaction capacity currently under construction is due to come online, with the vast majority of this coming from the US Gulf coast. With this increase in supply, demand growth is again likely to be focused on China but more price sensitive markets may also grow in importance. The additional supply, coupled with weakness in Brent at the turn of new year, is likely to influence the underlying price of LNG. At the start of 2019, the UK NBP forward curve is trading at approximately $6.65/MMBtu for the summer, $1/MMBtu below summer 2018. The softening of spot LNG market prices comes at a time when the industry is expecting a record year for new liquefaction project FIDs.
See Gas Strategies’ “LNG Outlook 2019” for a broader assessment of the year ahead in the LNG industry
If you would like more information about how Gas Strategies can help your business with Consulting services across the value chain or provide industry insight with regular news, features and analysis through Information Services or help with people development through Training Services, please contact us directly.