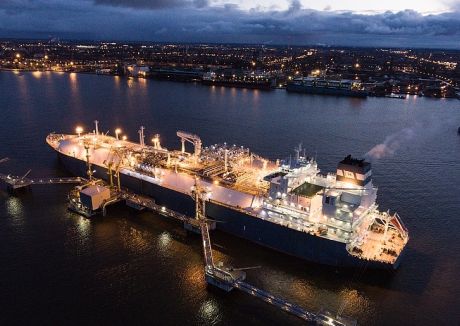

The outlook for the LNG shipping market was boosted in early June by the signing of a huge newbuild vessel order by Qatar – lifting a sector which had been floating in the doldrums, with new orders lower in recent years. This has prompted us to consider the current shipping fleet, along with the existing order book, to form a forward looking view of the sector, both in the context of the wider LNG market – specifically shipping length versus liquefaction capacity – and the key issues which face shipping charterers and owners in the coming months and years.
Our analysis of the existing LNG fleet and orderbook[1], combined with our view of future liquefaction capacity[2] shows there is ample length in the shipping market out to at least the mid-2020s (see Figure 1). Given new deliveries expected over the next four years will arrive at time of relatively little new liquefaction capacity coming online, the implied fleet utilisation[3] could fall to around 75% until 2024, down from 84% in 2019[4]. This suggests that current low spot charter rates (see Figure 2) may prevail until at least the middle of this decade.
Figure 1 - Global liquefaction and fleet capacity (2019-2035)
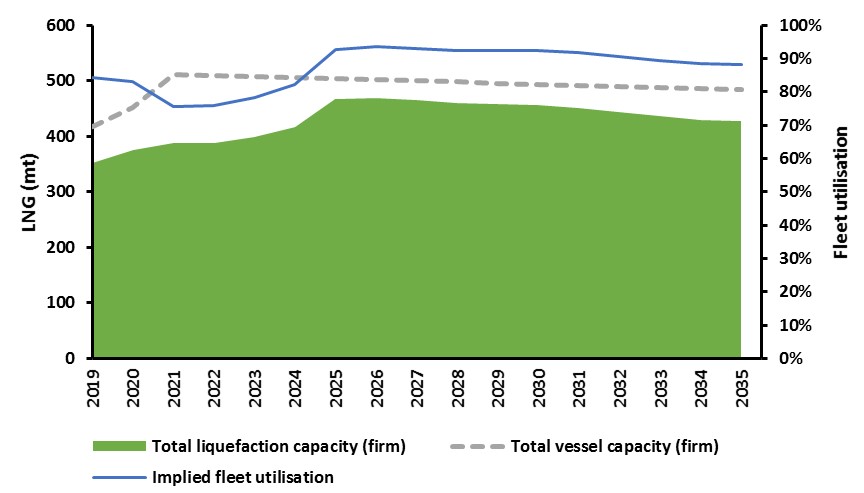 Source: Gas Strategies, GIIGNL
Too much of a good thing
A major headwind being experienced by the shipping market is that the LNG market it serves is fundamentally oversupplied. Weaker than anticipated demand growth – exacerbated by COVID-19 and coupled with record liquefaction capacity additions over the past 18 months – has led to the previously unprecedented market situation of today: multi-decade low commodity prices and LNG not being lifted by those with high cost capacity rights at US projects.
While the mass cancellation of cargoes by buyers is a recent phenomenon, a further issue is that many US LNG FOB offtakers commissioned ships based on the expectation that there would be a significant flow of LNG volumes from the US to Asian markets. However, with lower than expected LNG prices in Asia, the economics of such trade has become less attractive. This led to only 37% of US volumes being shipped to Asian markets in 2019 – with 38% and 21% of volumes shipped to Europe and the Americas respectively. This compares with 52% of US exports delivering to Asian countries in 2018, while 13% headed to Europe and 28% to other countries in the Americas.
This change in flows directly impacts the shipping market by significantly reducing the average round trip of vessels in the global fleet and in turn increasing the total tons of LNG a vessel may transport in a given period.
Figure 2 - LNG spot charter rates (January 2019-June 2020)
 Source: Reuters Eikon, Gas Strategies
All pain, little gain
Participants across the LNG shipping industry have felt the pain of low commodity prices. With regards to medium- to long-term charters, which constitute the majority of deals in the LNG ship space, companies which have surplus shipping capacity have no respite by sub-chartering their vessels on the spot market. And ship owners with vessels coming off charter in the current environment will face a significant challenge to lock-in new mid-term or long-term charters at favourable rates.This all leads to some key questions facing participants in LNG shipping:
- For LNG players, as described more fully in our previous blog “Moving minds, mindsets & metrics for effective LNG Portfolio Management”, shipping as not only a cost but an inherent enabler of value from LNG needs to be integral in portfolio strategy and optimisation. There is clearly a strong correlation between present day length in commodity / liquefaction capacity and shipping, while changes in LNG trade patterns have resulted in significant overcapacity in shipping.
- One opportunity for the LNG players holding charters for vessels approaching the end of the contracted term is that they will find themselves with significant leverage, as shipowners will be keen to avoid their existing vessels coming off charter and into a period of market length.
- As the shipping market follows the LNG business to commoditisation, margins will continue to be narrowed. Different fleets will be challenged in different ways. Owners of older vessels – those fully-paid off or closer to full depreciation – may be more comfortable in a low charter rate world in which their variable costs are covered. Newer vessels, however, will need to repay their capital loans. This will be a major challenge for the previous generation of ships that are approximately 6 to 10 years old because i) their book value will be above what most buyers would be willing to pay to buy them outright and ii) low charter rates may mean their owners are unable to service the capital loans or cover balloon payments once existing charters end.
- Some of the hardest hit shipping companies may be those that that focus exclusively – or at least extensively – on LNG. Companies with cross-commodity shipping interests may be less exposed (e.g. via a market such as crude oil, with lower capex for equivalent vessel capacities and a much more liquid market). Although relatively rare to date, this could lead to sector consolidation, with the smaller / LNG-focused players being purchased by larger or more diverse organisations. However, as mentioned above, the market for second-hand LNG ships is limited and the gap between book value and the price anyone is willing to pay is significant.
- For any organisation seeking to raise finance for new builds or acquisitions, the market situation also poses a challenge as traditional sources of finance may be less willing to lend to the sector, which has long since waved goodbye to the heady days of $80,000 + daily charter rates.
Conclusion
The LNG shipping sector is starting to follow the broader LNG market in becoming increasingly commoditised, with lower margins to play for. There is growing potential for refinancing pressures to boil over as initial charter periods end and securing favourable rates on new charters – with balloon payments looming – becomes ever more challenging.
This could lead to a consolidation among shipping companies leaving those with the larger and more diverse portfolios with greater purchasing power at shipyards, better access to favourable financing terms and more competitive in targeting the reduced number and lower charter rate opportunities when they arise. Instead of entering a period of opportunity for new entrants and diversity in the LNG shipping sector, we could instead see the big players with their own portfolios thrive and take even more market share, with the implication that smaller and weaker players risk being cast adrift.
There also remains significant risk for LNG players – even the big fish – to feel further pain in addition to the current low commodity prices if they are unable to renegotiate charter rates or their shipping strategy does not properly compliment their LNG portfolio management.
[1] Based on Clarksons research published in the GIIGNL LNG 2020 annual report. This report – and our analysis – excludes the Qatari shipping order.
[2] Future capacity build-out used in this analysis includes currently operational plants, those already under development and decommissioning of existing plant. It does not include pre-FID projects.
[3] Implied fleet utilisation already accounts for expected downtime of vessels during e.g. drydocking, special surveys, weather allowances etc. It is therefore the utilisation of “available” time.
[4] Our assumption on the duration of a round-trip is based on the average journey time from Qatar, US, Australia and Russia weighted by volume
***
Please contact us directly to find out more about the assumptions we have used in the analysis behind this blog (including liquefaction capacity build out, ship orders and calculations of fleet utilisation). We are delighted to discuss these topics with you, along with our insights on the shipping sector, wider LNG market and LNG integrated portfolio management and optimisation.