As oil prices gyrate violently from one extreme to another, more records are tumbling. Month-ahead Brent and WTI futures both recorded their strongest ever day of gains on 2 April 2020, soaring more than 20% to settle at USD 29.94/barrel and USD 25.32/barrel after US president Donald Trump raised hopes of a deal to end the Saudi-Russia oil war. Notably, the price of both commodities has held up this morning, with Brent gaining as much as 10% during intra-day trading on Friday, despite growing doubts around the credibility of the president’s claims.
Until yesterday, Brent’s biggest daily gain in percentage terms was 14.05%, recorded on 6 August 1990, followed by gains of 13.77% on 23 March 1998 and 13.71% on 7 January 1991. WTI gained 15.29% on 23 March, 15.06% on 4 August 1986 and 14.54% on 6 August 1990, according to historical price data from Investing.com.
Records also fell in the natural gas space, as US natural gas benchmark Henry Hub struck a new multi-decade low on Thursday, falling 2.2% to USD 1.55/MMBtu. Henry Hub has not settled at or below this price since the start of the millennium, amid resilient production, rapidly falling demand due to the economic impacts of Covid-19, high gas storage levels and the onset of warmer weather.
Front-month futures and indexes at last close with day-on-day changes (click to enlarge):
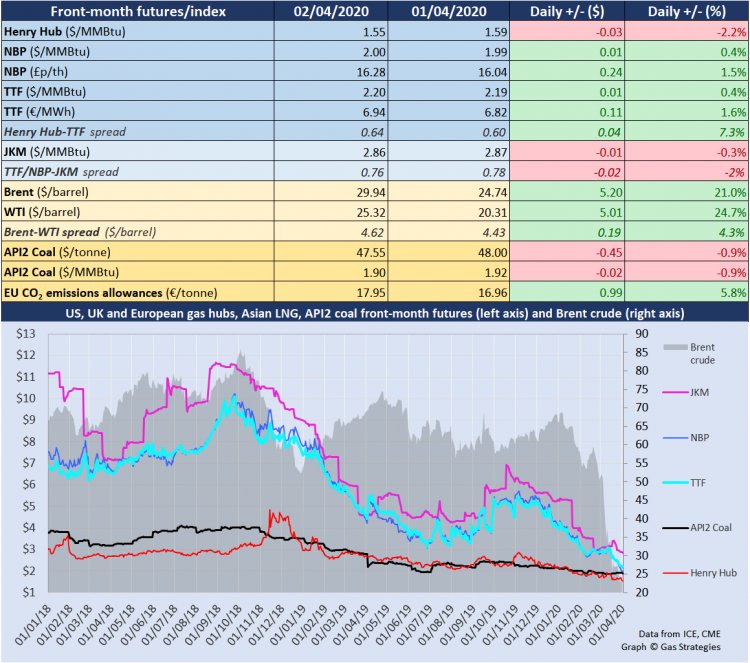
Time references based on London GMT. Brent, WTI, NBP, TTF and EU CO2 data from ICE. Henry Hub, JKM and API2 data from CME. Prices in USD/MMBtu based on exchange rates at last market close. All monetary values rounded to nearest whole cent/penny.